TL;DR: To create diagrams that can be updated from data in a file, I used Inkscape to create the layout, labelled all the diagram elements I want to update, put the data into a CSV file and used some Python code (with the ElementTree XML API) to update the SVG file.
I’ve been experimenting with a new project, WorldCupWallCharts.com (update: now defunct!). It’s a site where I create PDF wall charts that people can download and print out, to help them follow major sporting tournaments. It’s not really a development project, but I still found a way to write some code while working on it recently 🙂
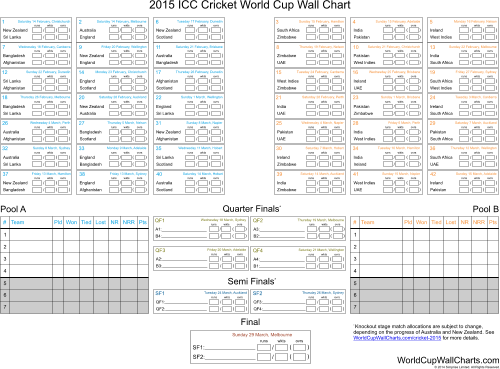
All the text elements on this diagram were typed in by hand…